
Heatmap of Throughput
Disclaimer:
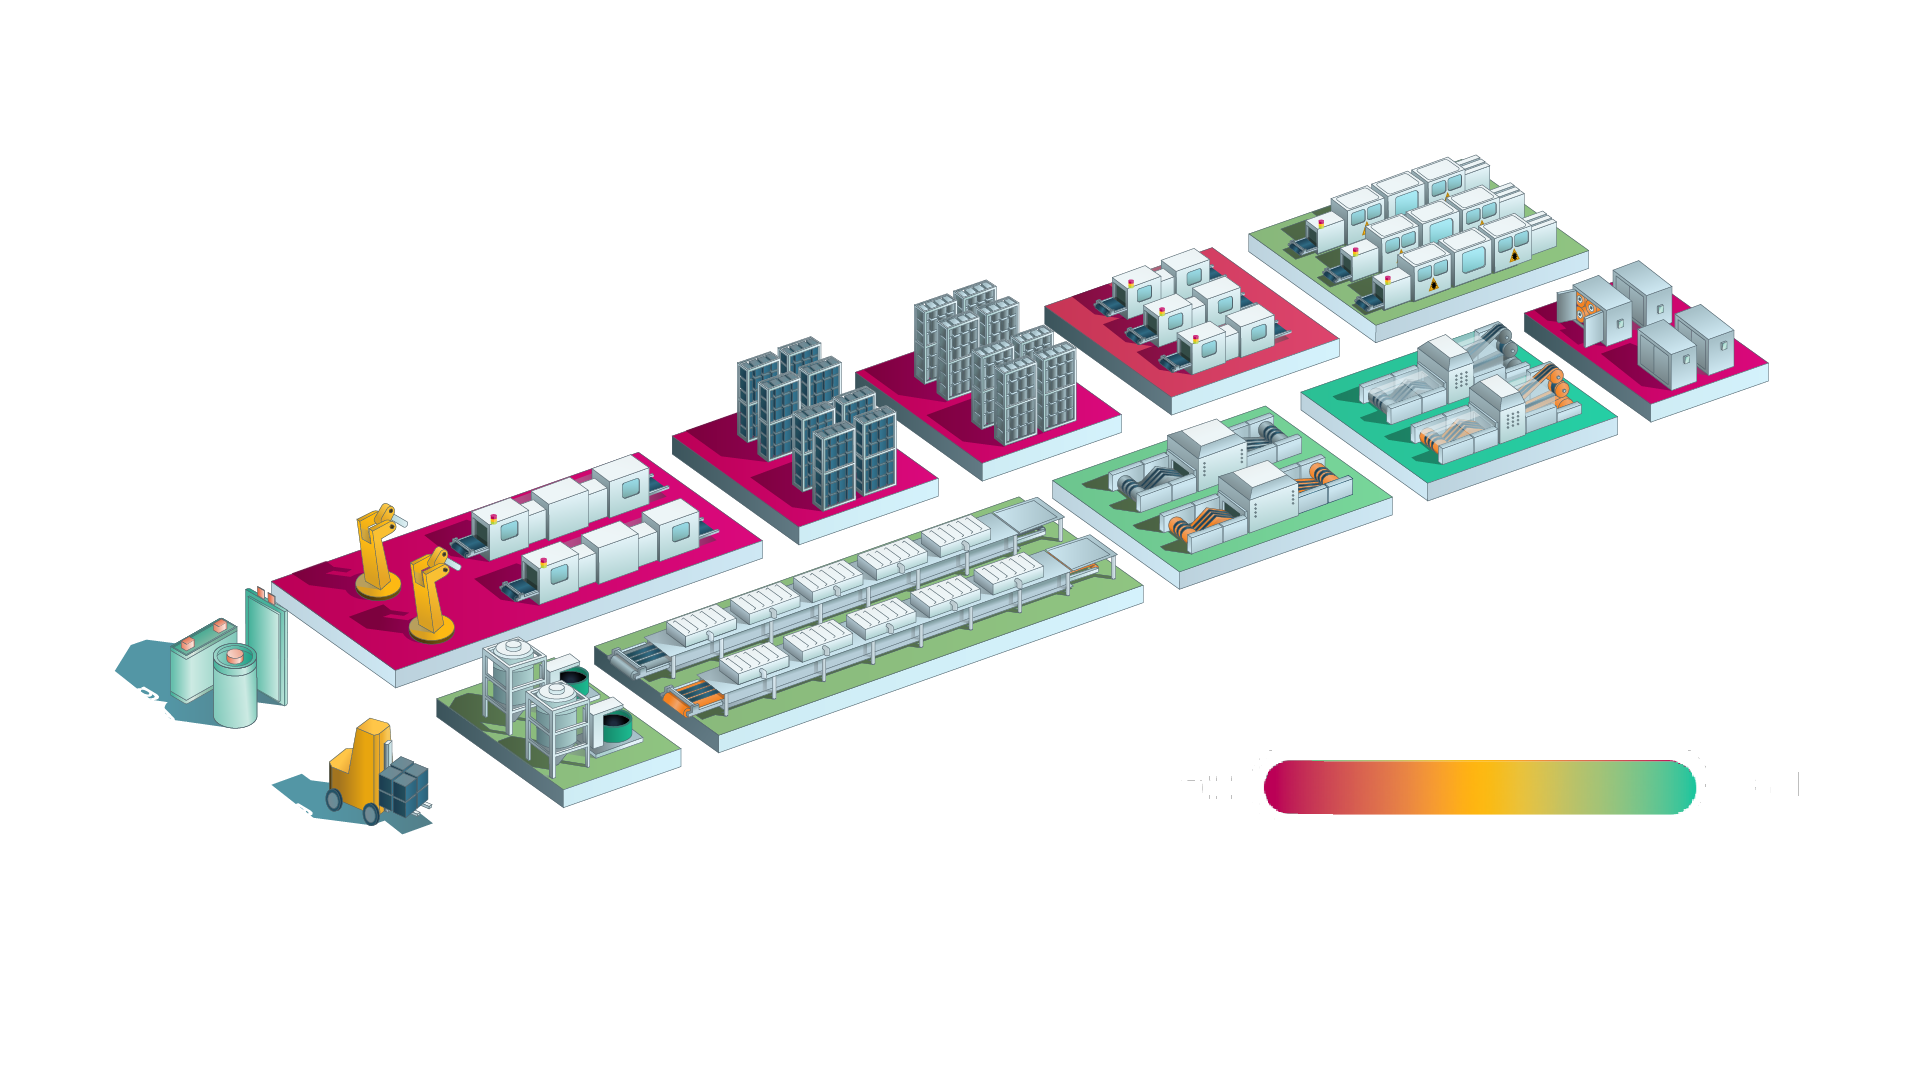
Throughput is related to machine output. In general, machine output refers to the amount of product (in this case, a lithium-ion battery cell) being produced within a specified time. Throughput refers to how much of a particular product is produced per unit of time. In this heatmap, throughput describes the rate at which lithium-ion battery cells are manufactured and is expressed in units of meters per minute.
Where necessary, the units typical for each process step were converted, or modeling assumptions were made to enable a (direct) comparison of throughput and machine output between the process steps.

Incoming Quality Control
A moderate impact on machine output
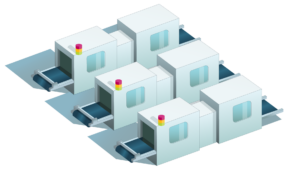
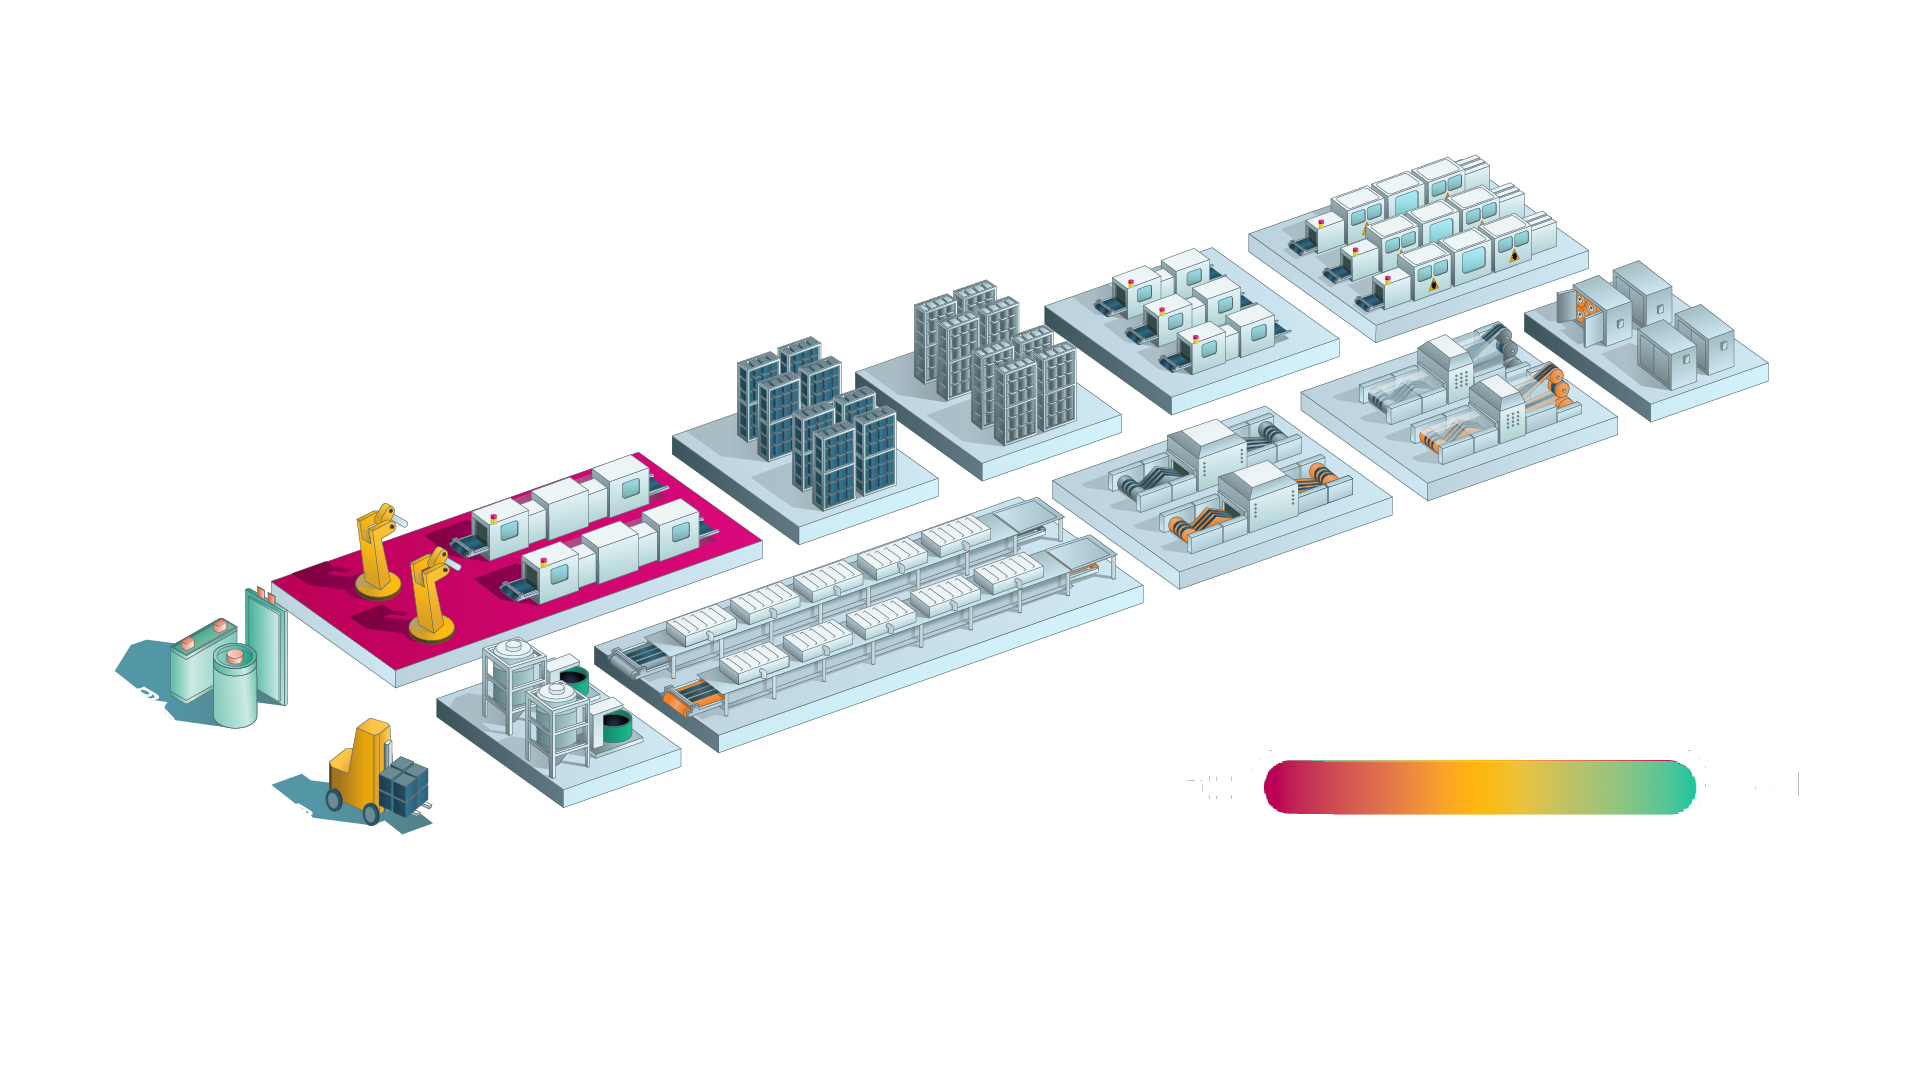
Incoming Quality Control (IQC) describes the inspection and testing of incoming materials used in production of lithium-ion batteries. The incoming materials directly influence the functionality, quality, and various other factors of the manufactured cell. IQC typically includes material testing, dimensional inspection, visual inspection, environmental testing, and specific tests tailored to the material, such as chemical analyses. The tests and inspection methods chosen to determine the tasks associated with this process step and therefore, the time required for IQC. Consequently, the throughput of IQC differs in academic literature.
Overall, the throughput in Incoming Quality Control is quantified at 55 m/min. This metric is based on the sampling frequency.
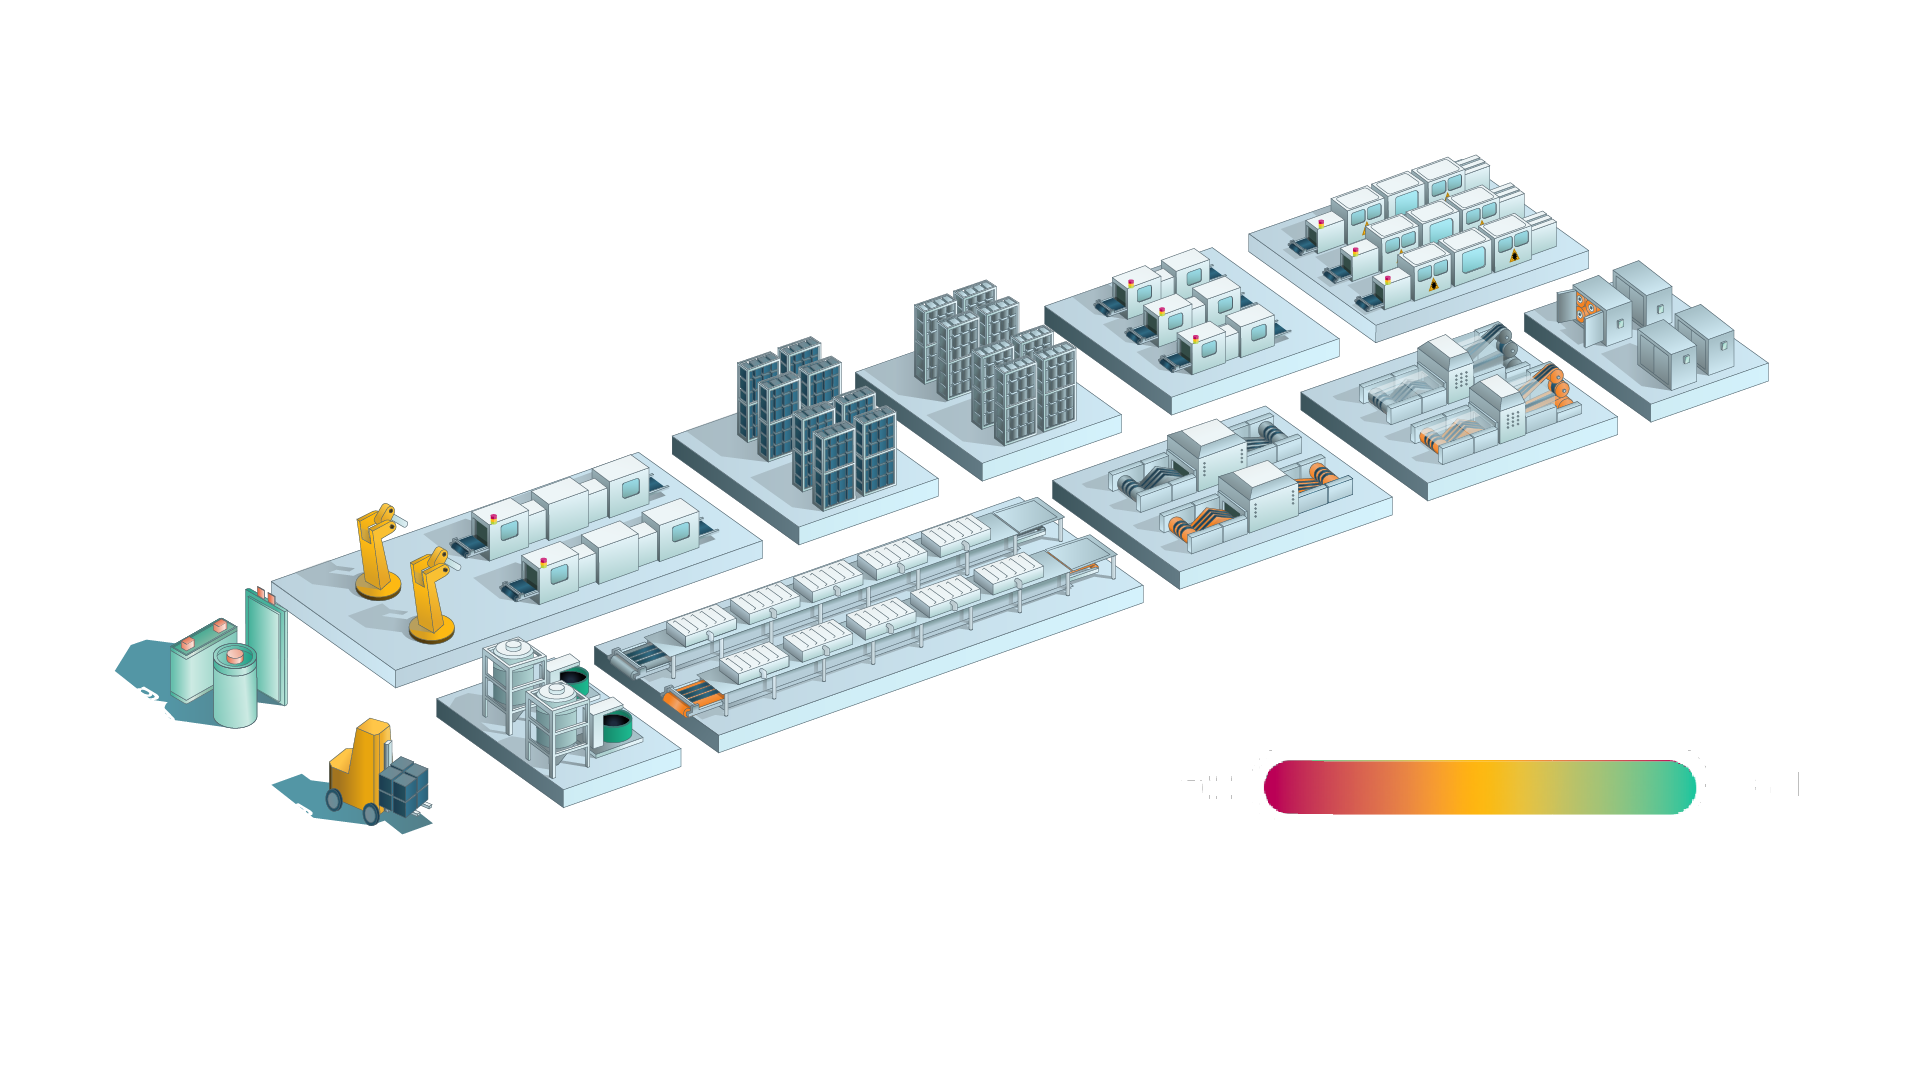
Dosing & Mixing
Variances depending on the scale of battery cell production
During the dosing and mixing process step, the throughput is relatively high. As the throughput is relatively high, this process step is more efficient in terms of productivity relative to machine output compared to other process steps.
The potential throughput in this process step varies considerably. The main reasons for the differences in throughput are (1) the production volume, (2) the mixer type, and (3) the viscosity of the slurry. For example, the volume of the mixers is larger for higher production volumes (at a larger scale), which has a positive effect on throughput and thus machine output. Common optimization approaches to account for the above factors include opting for continuous instead of batch mixing, first to shorten the cleaning time of the mixer, and second to reduce the latency associated with batch mixing. In addition, dissolving the binder in a separate container prior to mixing can contribute to shortening the time required for the slurry to form. Furthermore, parallel mixers or mixers with larger volumes are used to optimize the timing of the dosing and mixing process step. One optimization strategy that is increasingly used is the adoption of “twin-screw extruders”. Twin-screw extruders are designed to ensure more homogenity of the slurry. They are often used to reduce the time required for this process step too. The third factor influencing throughput in this pro-cess step is the viscosity of the slurry. The viscosity is an indicator of whether the mixture is homogenous and finely dispersed. It is also typically monitored to prevent agglomeration, which leads to higher energy costs in this process step. In addition to the adoption of “twin-screw extruders”, there are other optimization strategies, such as in-line sensors to ensure better alignment with the following process steps. Taking the above factors into account and implementing optimization strategies can reduce the time and/or throughput of the process step, thereby also influencing machine output.
The throughput for the dosing and mixing process step ranges from 23.15 m/min to 155 m/min. This metric was converted by the metric kg (of processed slurry) per hour.
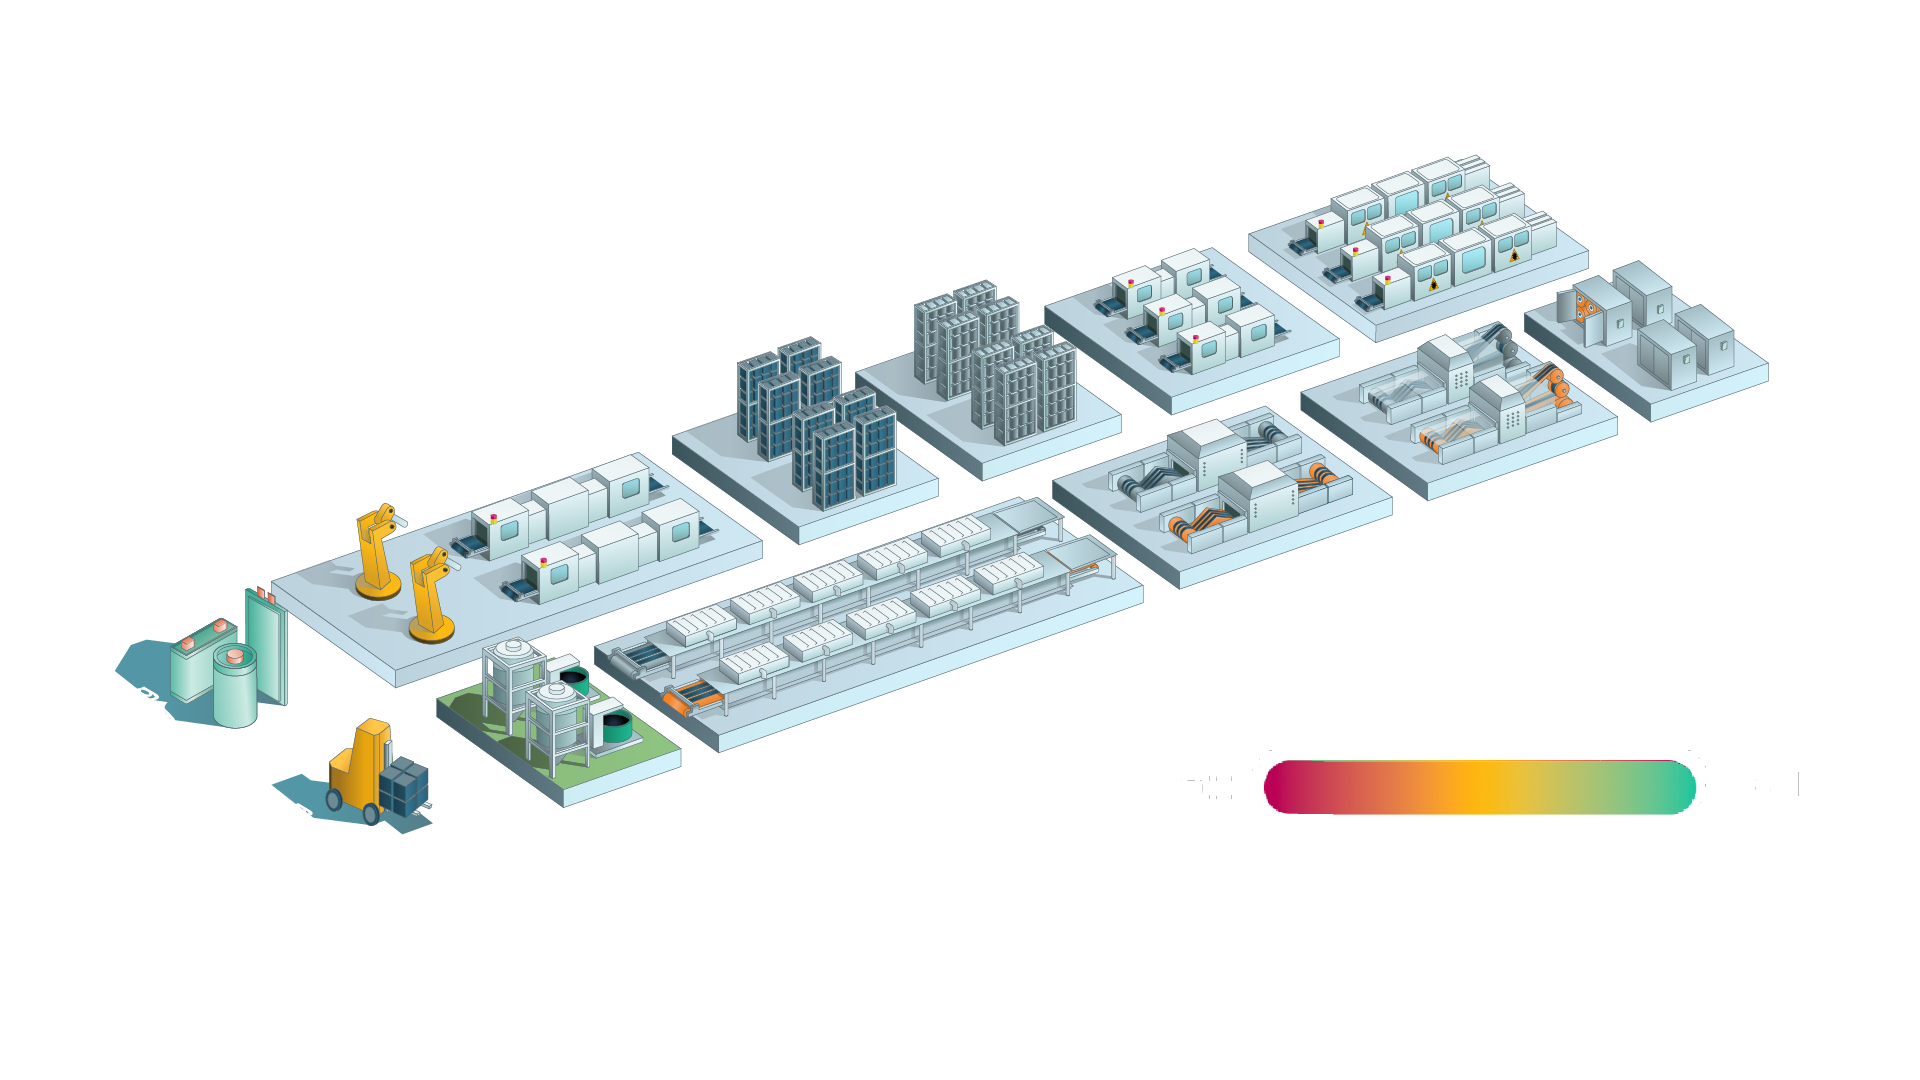
Coating & Drying
Moderate impact on throughput and machine output
The throughput of the coating and drying process step can be considered moderate. In this process step, the slurry is applied to the current collector foil. Here, different application tools can be used such as a slot die or anilox roller. This substrate foil undergoes a coating process, followed by a drying process. Both the coating speed and the coating method influence throughput and machine output.
The coating can be applied either via continuous or intermittent methods. Moreover, coating the top and the bottom can be done simultaneously or sequentially. Both the method as well as the choice between simultaneous and sequential coating affect the time required for the coating and drying processes, which in turn impacts throughput and machine output.
For this reason, common optimization strategies focus on (1) improving the web speed, (2) the uniformity of the coating weight, (3) the drying oven itself, and (4) the coating method chosen. During the coating and drying process step, a high web speed may assist in increasing the throughput. Modern approaches can aid in exceeding 80 m/min for anodes and 60 m/min for cathodes. However, adjusting the set-up towards a high web speed increases the occurrence of coat weight variations. If those variations exceed the specified threshold, there is a higher likelihood that scrap is produced. Accordingly, the net throughput decreases. Therefore, the monitoring of the uniformity of the coating weight is used more frequently. However, the optimization of the uniformity of the coating weight is increasingly favored to improve the net throughput of this process step. The third factor mentioned above, the drying oven, has a significant impact on the throughput of the coating and drying process step. The length of the drying oven typically ranges between 45 m to 120 m. It is often the case that, as a general rule, a speed of 80 m/min requires a dryer length of approximately 80 m to 100 m. In general, a longer drying oven has a positive effect on throughput. During the drying process itself, however, a balance must be found between evaporation and the risk of, for example, cracking. Cathode drying generally proceeds 10% to 20% slower than the anode drying. In addition, the coating method chosen affects the throughput of this process step. Coating can be performed using ei-ther continuous or intermittent methods. The choice of coating method, however, depends on the respective battery cell manufacturer. Overall, various aspects of the coating and drying process can be optimized according to the requirements of the respective battery cell manufacturer.
The throughput for the coating and drying process step varies from 30 m/min to 180 m/min. This metric was converted by the web speed in m/min.
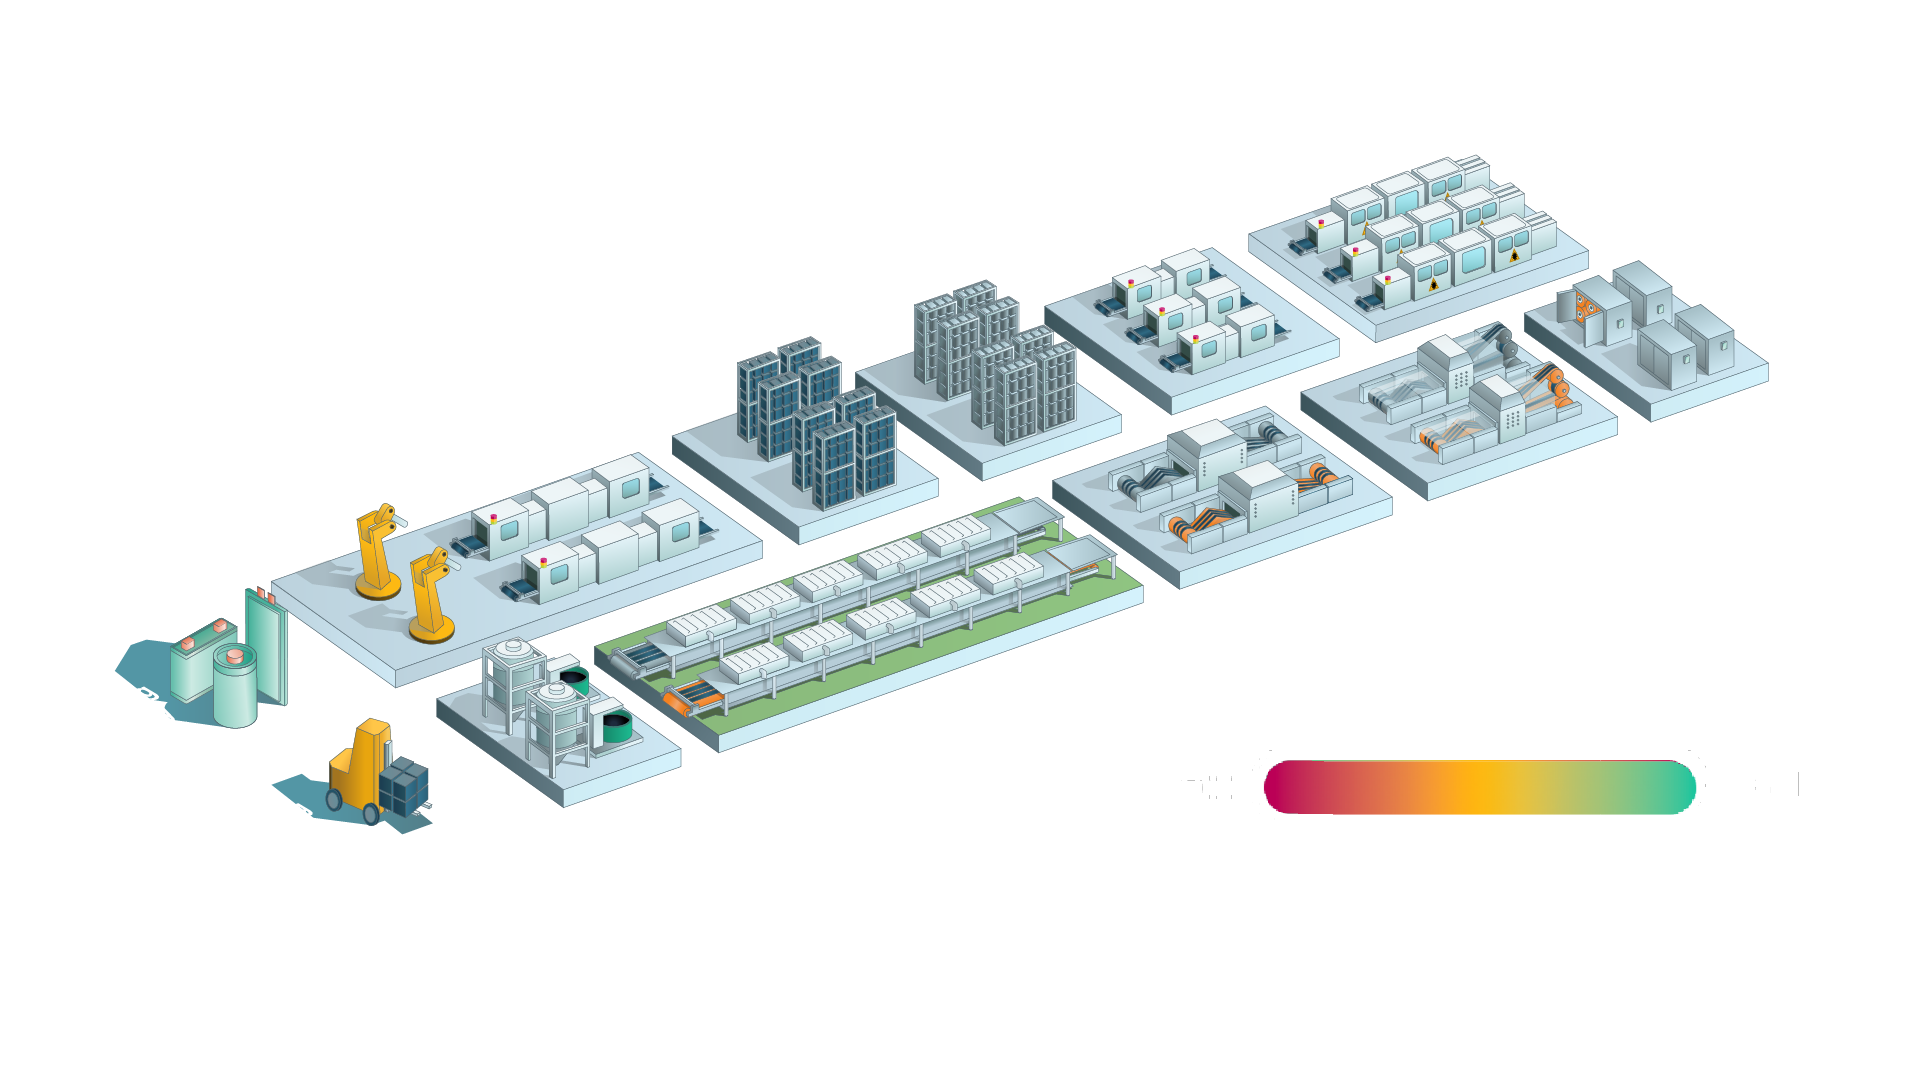
Calendering
Further optimized at scale
Calendering refers to the process of porosity reduction by compacting the electrode coating produced in the preceding process steps. The throughput in the calendering process step is influenced by various factors, including (1) roll gap and line pressure, (2) web speed, and (3) roll temperature. The roll gap and line pressure affect throughput because the calender rolls exert pressure that depends on the required ratio, i.e., the ratio of thickness before to after the calendering process step. This ratio determines the number of passes. For example, with a thick electrode for high-energy-density cells, the compaction ratios are relatively high. In this case, two to three passes would be required, which in turn means halving or reducing the net throughput by a third. The web speed also influences throughput, as an excessively high web speed carries the risk of insufficient compaction, which negatively impacts throughput and machine output. The third key factor influencing throughput in this process step is the roll temperature. A higher temperature aids in softening the binder, reduces the required line pressure, and improves electrode quality (e.g., due to improved electrical conductivity). Overall, a higher temperature has a positive effect on throughput, but the achievable temperature is limited by the properties of the material used. In general, calendering is a process step with a relatively high throughput and corresponding machine output compared to the other process steps. However, there are various approaches to further optimizing throughput in the calendering process step, e.g., with regard to optimizing web speed. Consequently, the throughput and machine output differ significantly and are usually further optimized at scale.
The throughput for the calendering process step ranges from 25 m/min to 265 m/min.
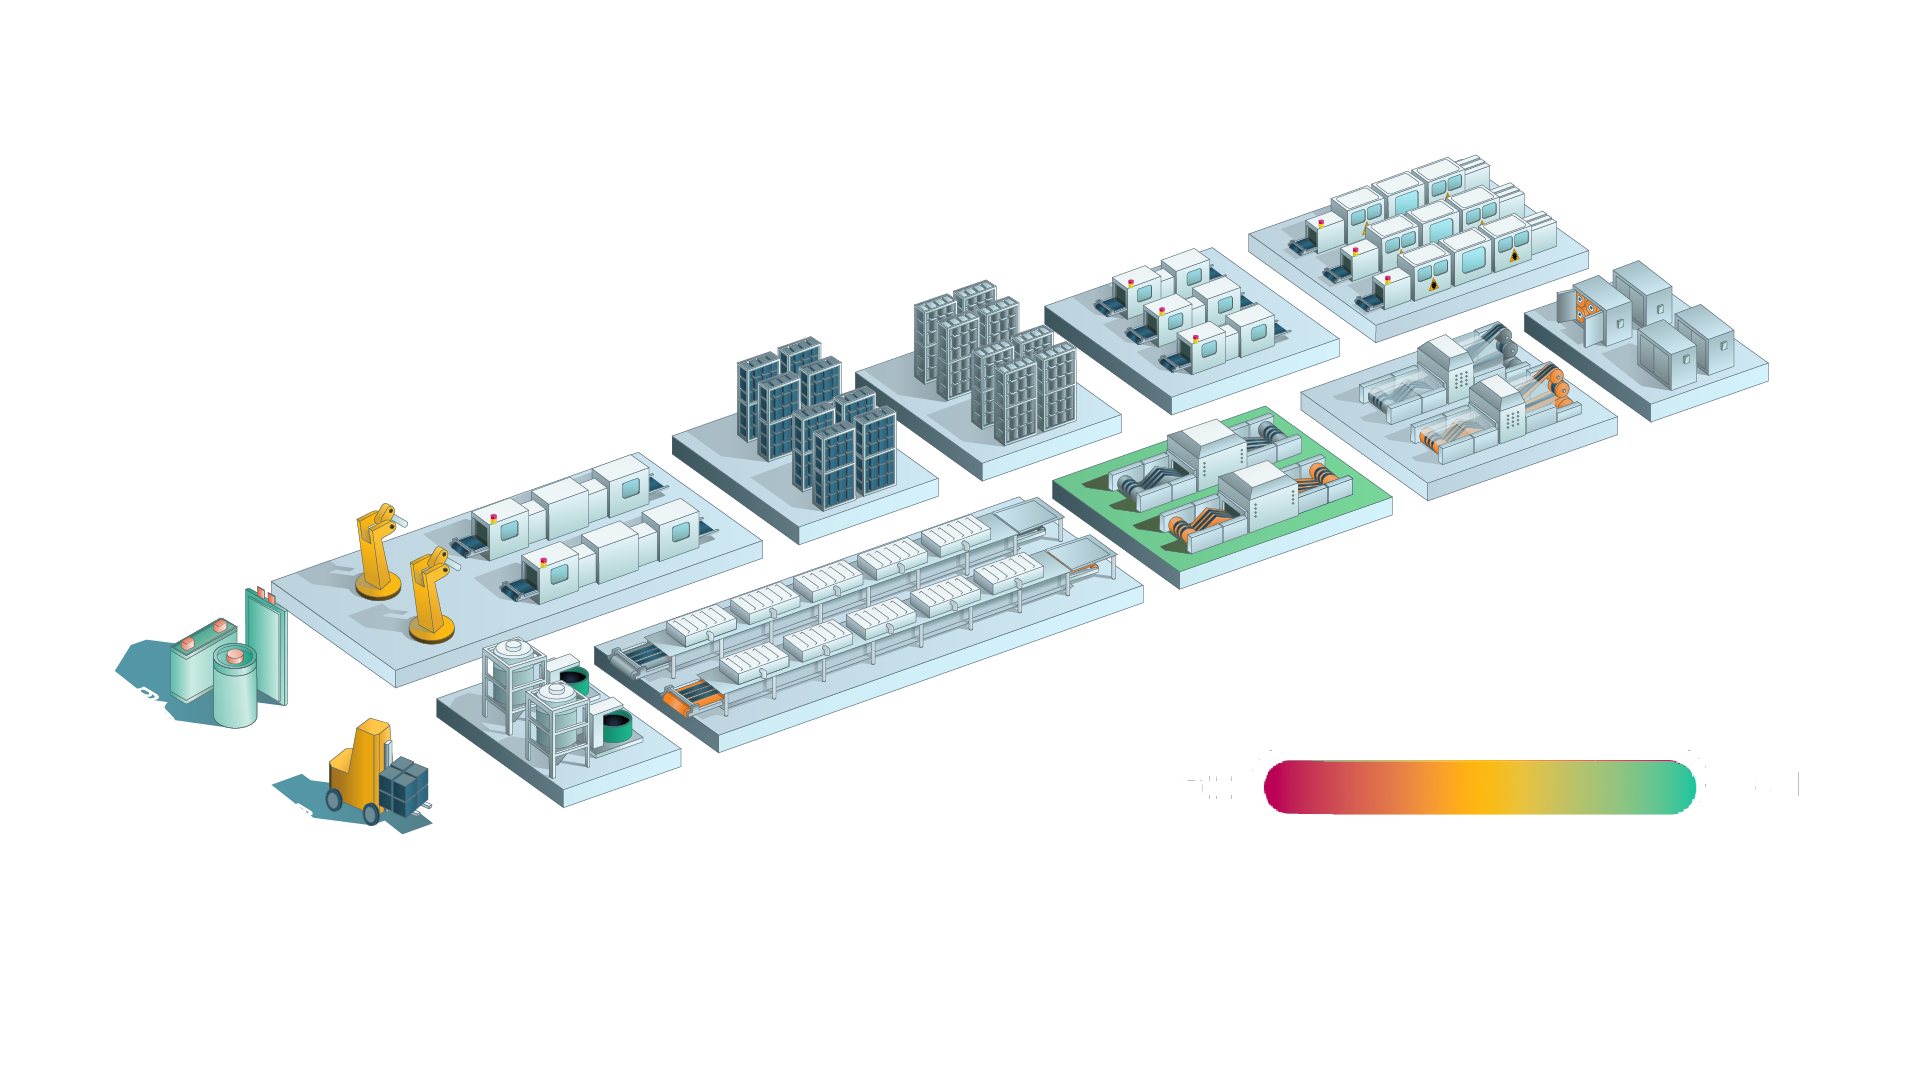
Slitting
Highest throughput in the entire battery cell production process
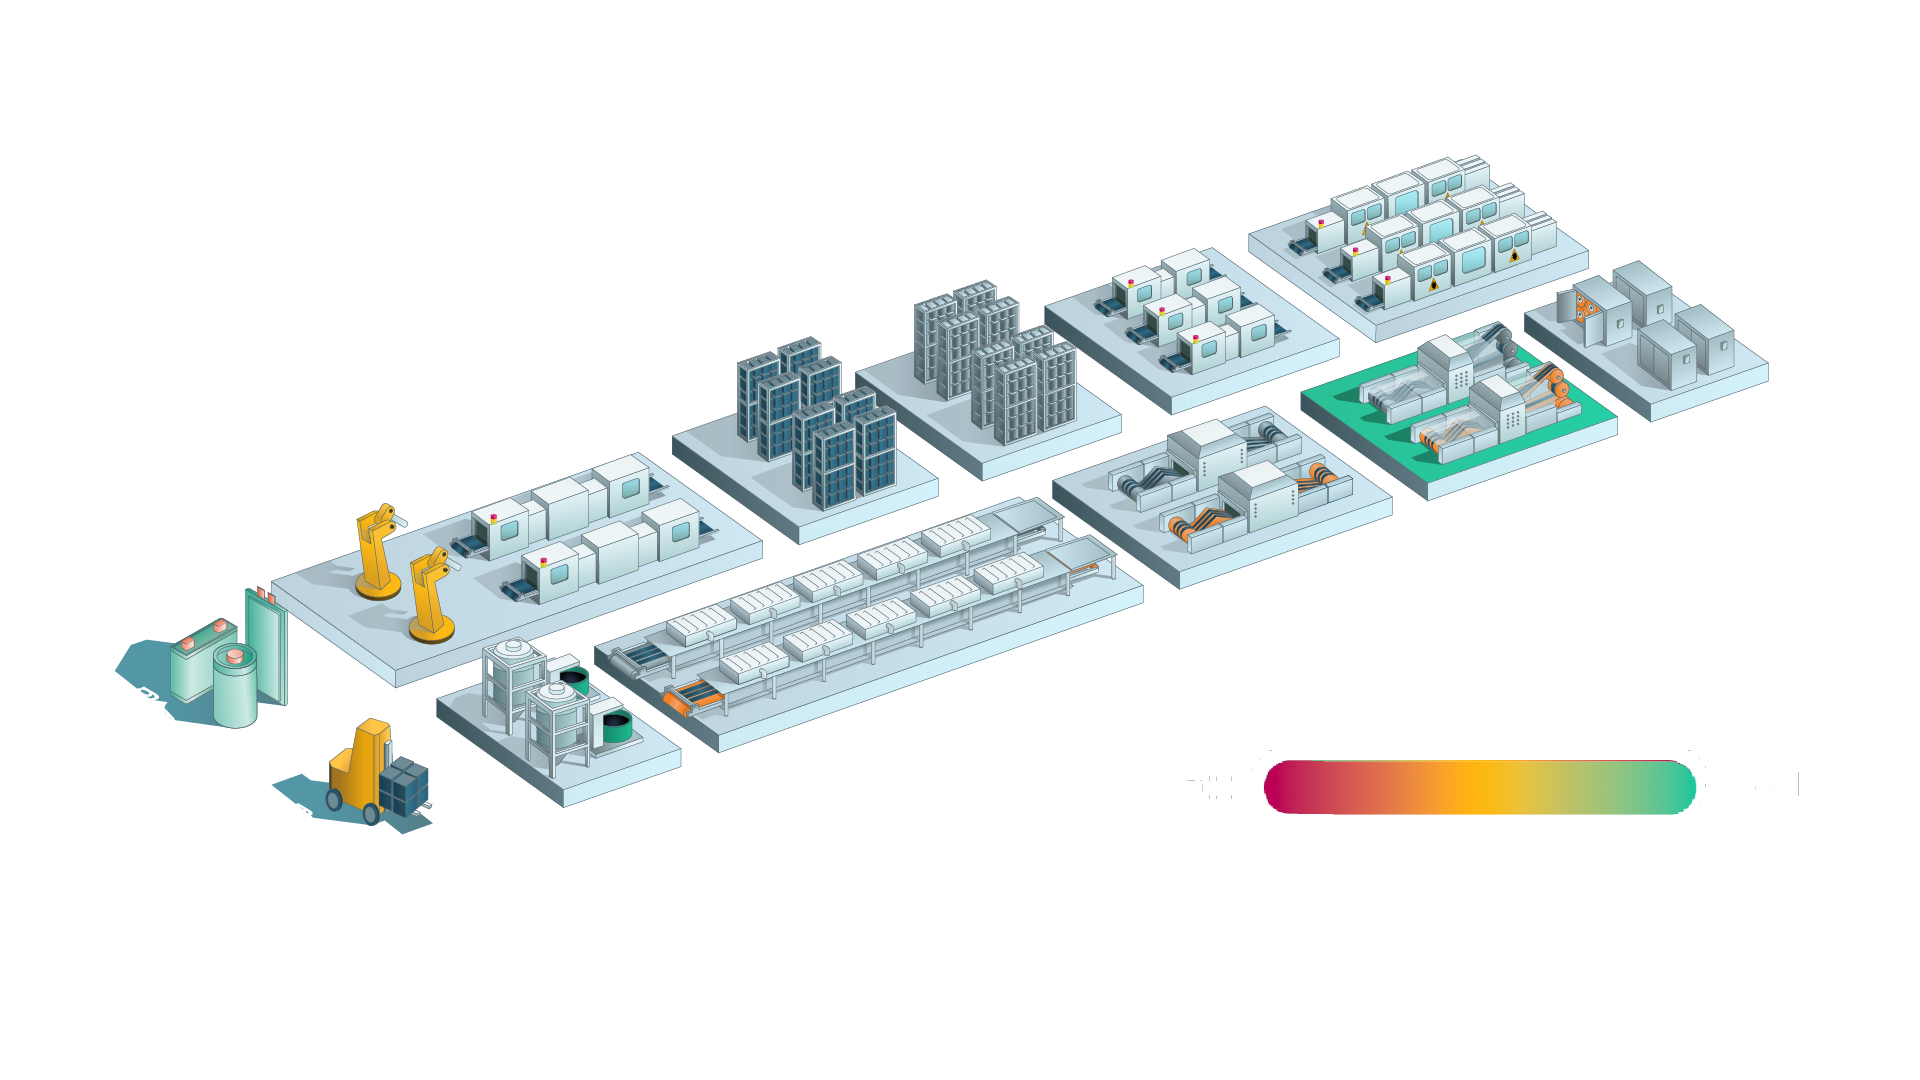
The throughput in the process step of slitting is considered the highest in the entire battery cell production process. Generally, the slitting process step refers to the conversion of the electrode web into strips. The width of these strips is tailored to the width required for the assembly process step.
In the prior process steps, it was explained that the web speed is one of the factors that limit the throughput and machine output of the respective process step. Normally, the web speed does not pose a limitation in the slitting process step, as it is relatively high compared to the other working steps in electrode manufacturing. However, two other key factors limit the throughput of this process step: (1) the tolerance of the slit width and (2) the number of slits per roll. The first aspect limits the process throughput due to the fact that the cell assembly is sensitive to the electrode width. Especially on an industrial scale, the number of lanes and the roll width are typically optimized to further increase throughput and also machine output. One of the optimization strategies is laser slitting, which helps to increase throughput.
The throughput for the slitting process step ranges from 80 m/min to 310 m/min. This metric was converted by the relation between the rate in m/min and the lanes (as a multiplier).
Vacuum Drying
Moderate throughput and machine output depend on effective monitoring
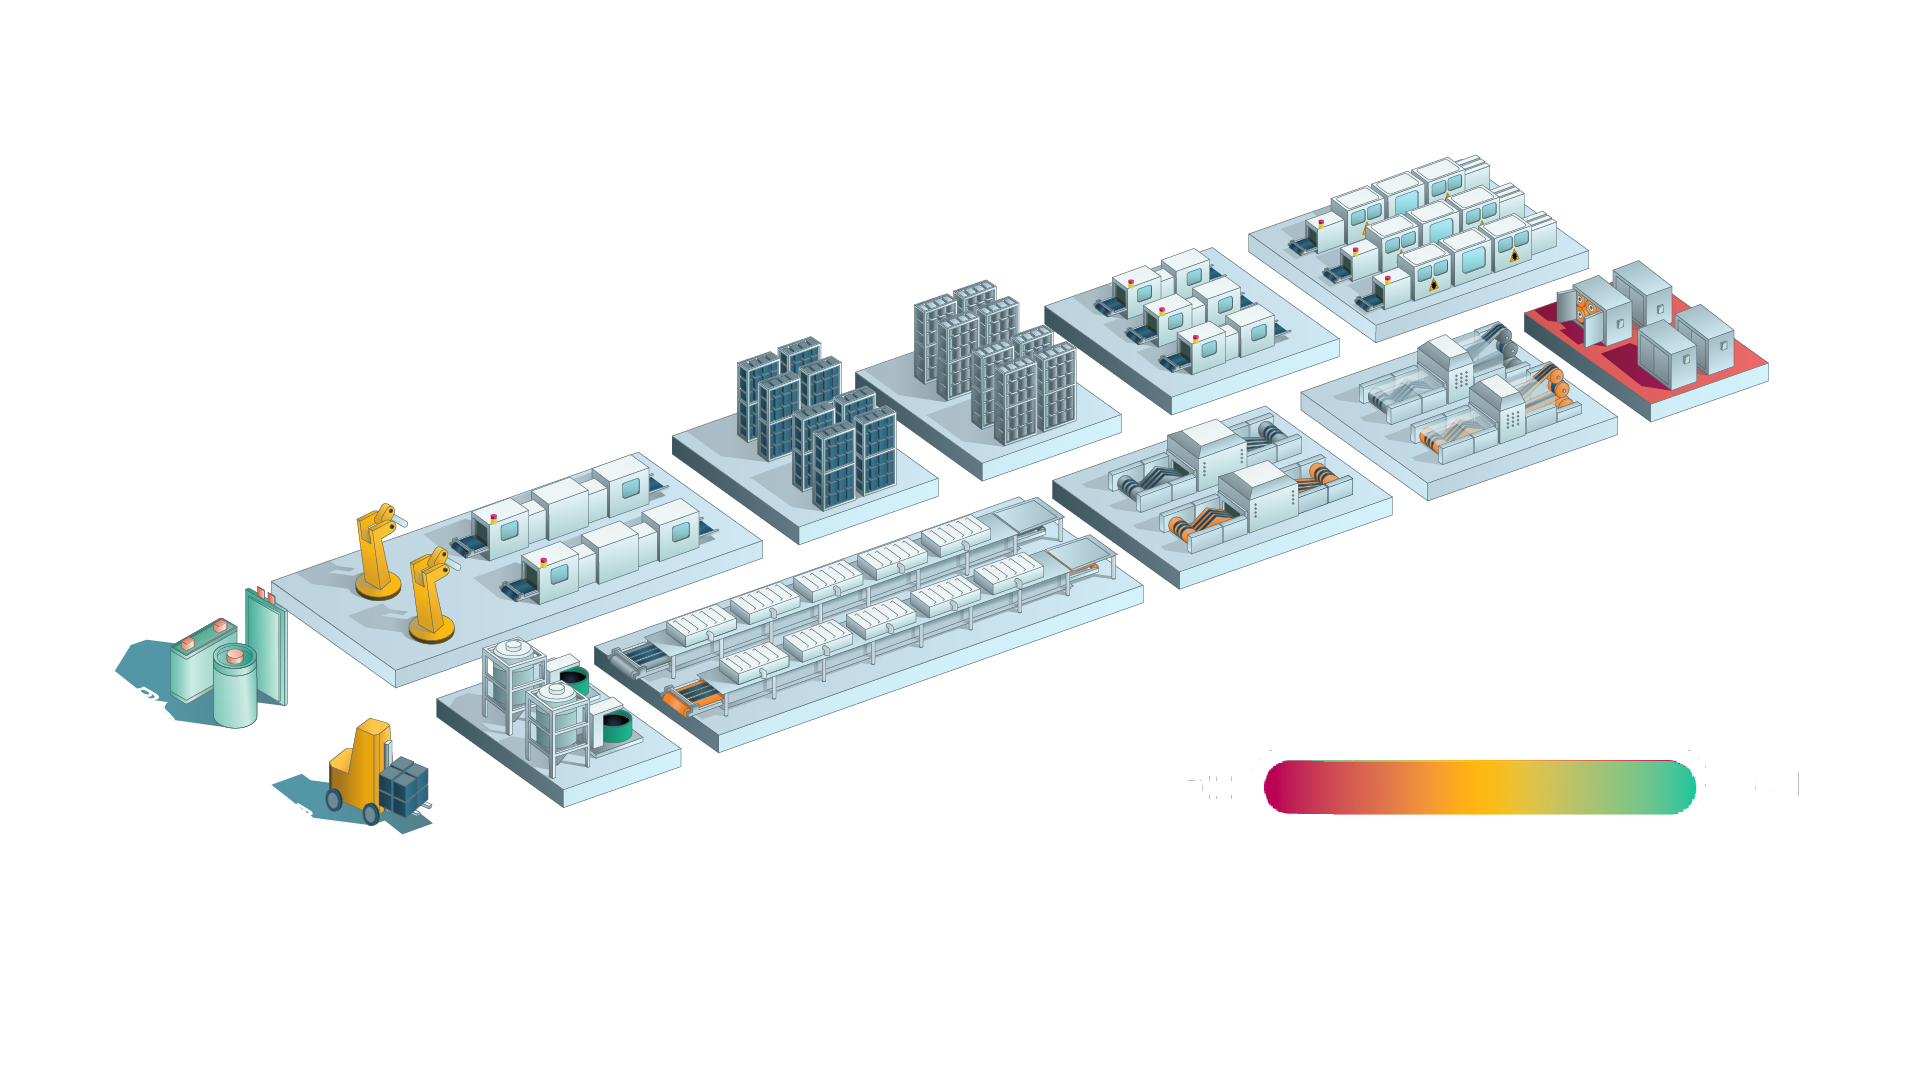
The vacuum drying process step involves transporting the manufactured daughter coils to the vacuum dryer, where they are stored until further processing. The drying process itself is time sensitive and lasts 8 to 48 hours long. Therefore, throughput is affected by (1) loading density and stacking, (2) temperature, and (3) the approach to dew point monitoring. Vacuum ovens commonly process the coils and stacks simultaneously. In this respect, however, load density limits throughput. If the vacuum oven is overloaded, the drying time lengthens without a proportional increase in throughput. This tendency also applies to underloading. Furthermore, temperature represents an additional constraint, as the maximum drying temperature limits the potential for optimization with regard to the total drying time. With regard to temperature, two factors must be taken into account in the process step of vacuum drying: (1) the binders used limit the maximum possible temperature and (2) moisture desorption is subject to solid-state diffusion kinetics. Thus, the temperature cannot be increased arbitrarily, as this would otherwise compromise the electrode itself or the properties of the binders. Both would impair the functionality and quality of the manufactured cell. Overall, the throughput of the vacuum drying process depends on specific parameters, such as the temperature of the vacuum oven.
The throughput for the vacuum drying process step ranges from 5.5 m/min to 46 m/min. This metric was converted by the rolls per oven per cycle and time.
Assembly
Various optimization approaches
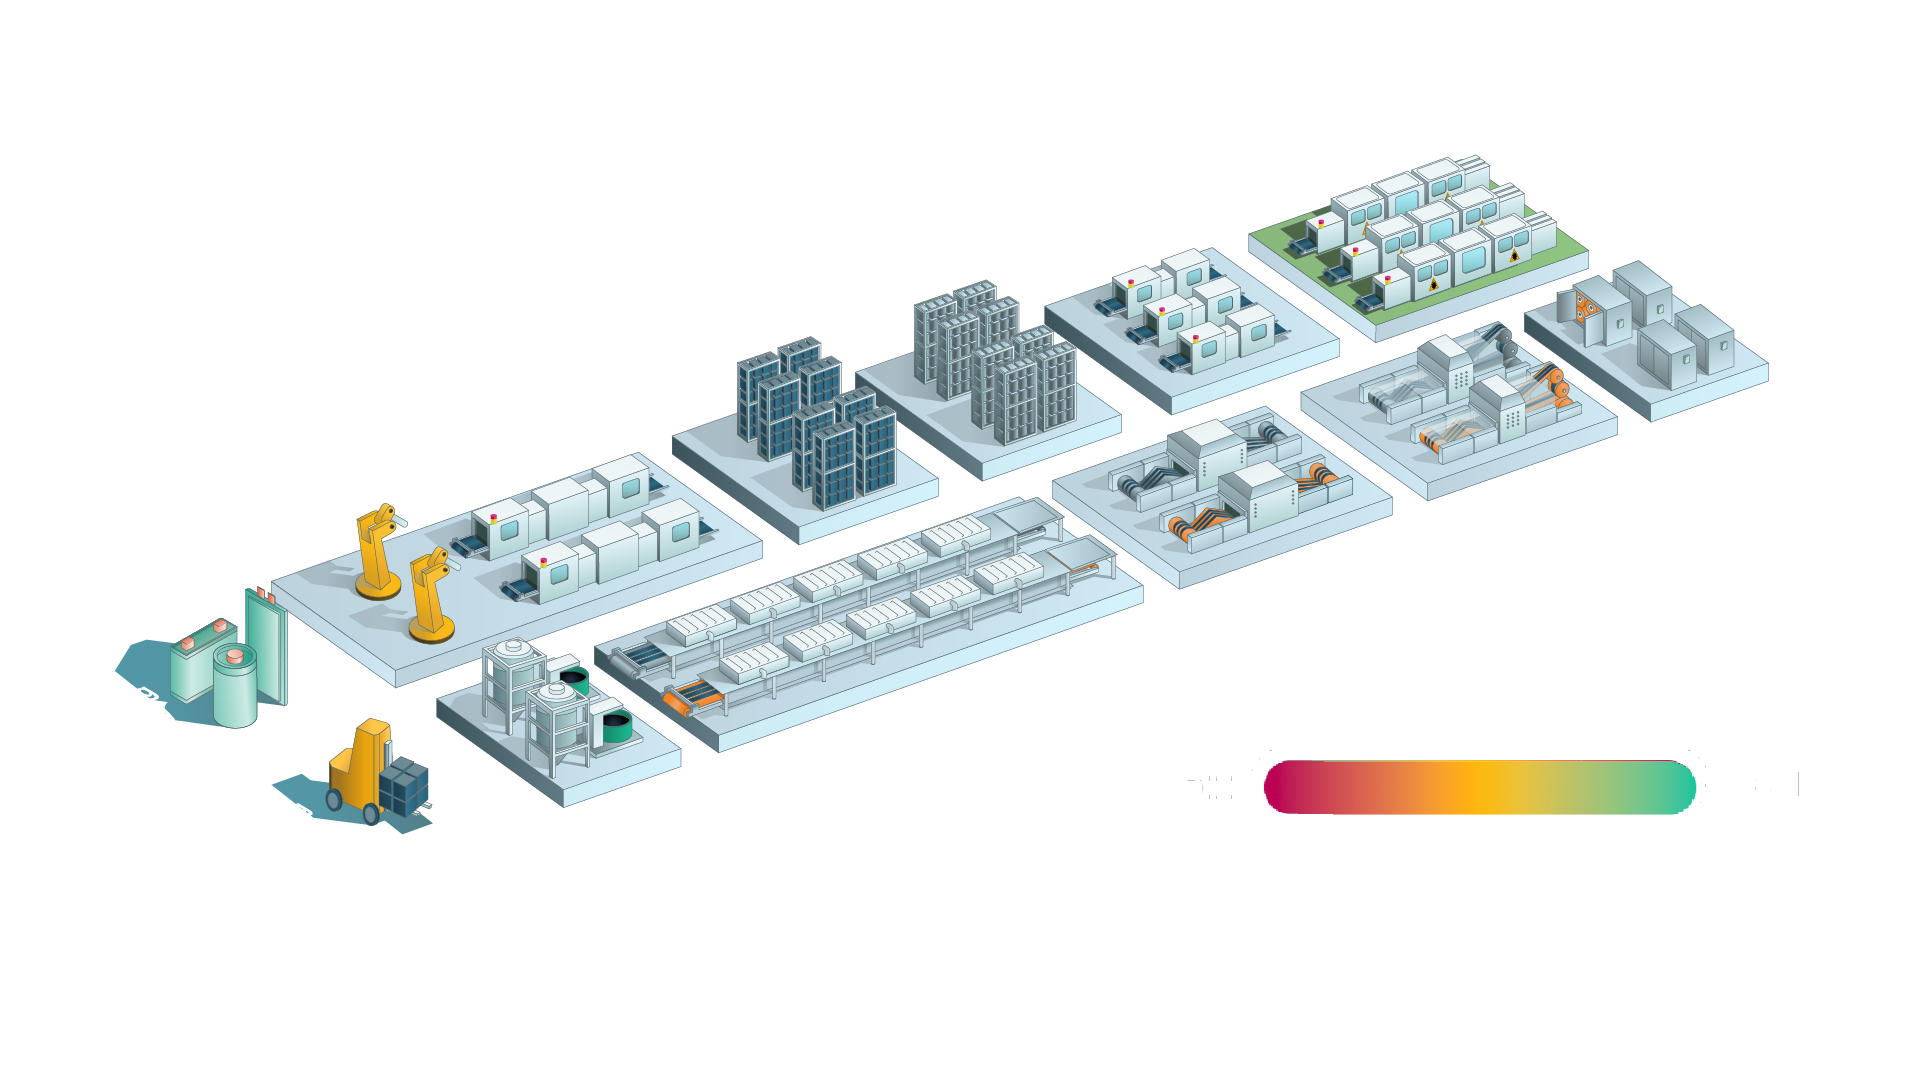
The assembly process step determines the functionality and reliability of the produced cell, i.e., the final product. The throughput and machine output are relatively high. The specific throughput depends on process specifications and the optimization approaches integrated. The factors determining throughput in this process step primarily rely on the type of cell. In general, a distinction is made between winding and stacking. Stacking can be applied to prismatic and pouch cells (including z-folding). Winding can be applied to prismatic and cylindrical cells. The latter, winding, is a typical bottleneck, as the sheets need to be processed in parallel. In general, the various types each influence the number of cycles per minute, the potential number of cycles per minute, and the effects of using multi-spindle machines. There are several optimization strategies in the assembly process step. One of them is the switch from stacking to thermally laminated sheets. In specific, the cathode-separator-anode combination is prelaminated into a composite web prior to the stacking process. This increases the stacking rate, which has a positive effect on throughput and machine output. However, there are different optimization approaches, the use of which depends on the requirements of the respective battery cell manufacturer.
The throughput for the assembly process step ranges from 74 m/min to 138 m/min. This metric was converted by the rate in cells/min.
Electrolyte Filling
Main bottleneck in battery cell manufacturing
The impact of the electrolyte filling process step on throughput and machine output is relatively moderate. However, electrolyte filling is one of the main bottlenecks in battery cell manufacturing because of the difficulties associated with the wetting process step. These difficulties are exacerbated by the demand for battery cells with higher energy density. Generally, the electrolyte filling process involves the injection of liquid electrolyte. Consequently, throughput depends primarily on three factors:
(1) electrolyte infiltration kinetics, (2) viscosity of the electrolyte, and (3) accuracy of the filling process. It should be noted that a cell filled with electrolytes is not synonymous with a wetted cell. Therefore, electrolyte kinetics influence the throughput of the electrolyte filling process step. Here, the electrolyte must completely wet both the porous electrodes and the sep-arator. For example, complete wetting typically takes longer in a battery cell where the electrodes are densely stacked. The increase in time required, in turn, affects the throughput of this process step. Additionally, the accuracy of the filling process has a significant impact on the machine output of this process step, as overfilling leads to electrolyte leakage and insufficient filling entails the risk of localized drying within the electrode. However, most of the factors mentioned above can be accounted for by adjusting the respective process parameters, thereby incorporating the factors that commonly affect throughput. This allows throughput to be further optimized at different scales. Another frequently used optimization strategy is the application of a vacuum during the electrolyte filling process. This optimization strategy significantly reduces both the time required for the wetting process and the soaking time. This, in turn, increases the throughput.
The throughput for the electrolyte filling process step ranges from 8 m/min to 29.8 m/min. This metric was converted by two factors. First, by the fillings process measured in cells/min and second, by the time required for wetting.
Formation
A common bottleneck in battery cell manufacturing
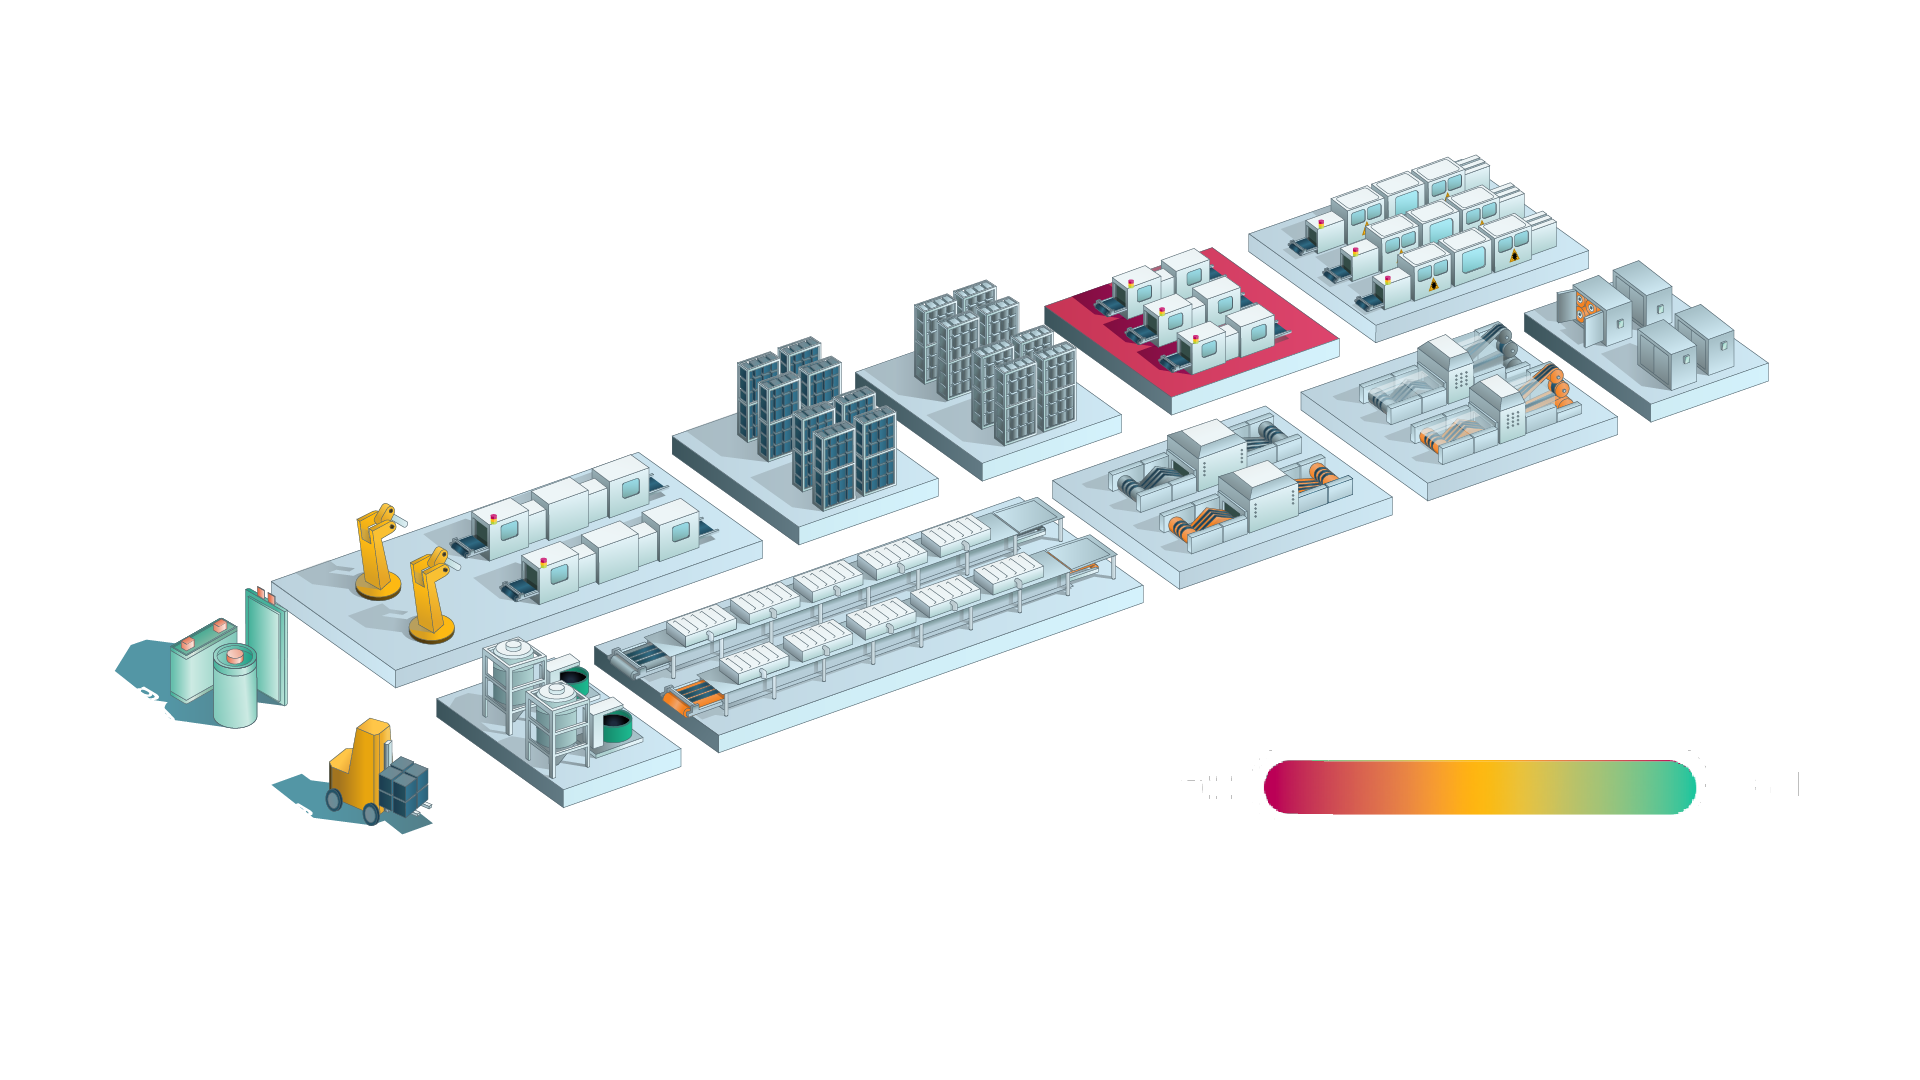
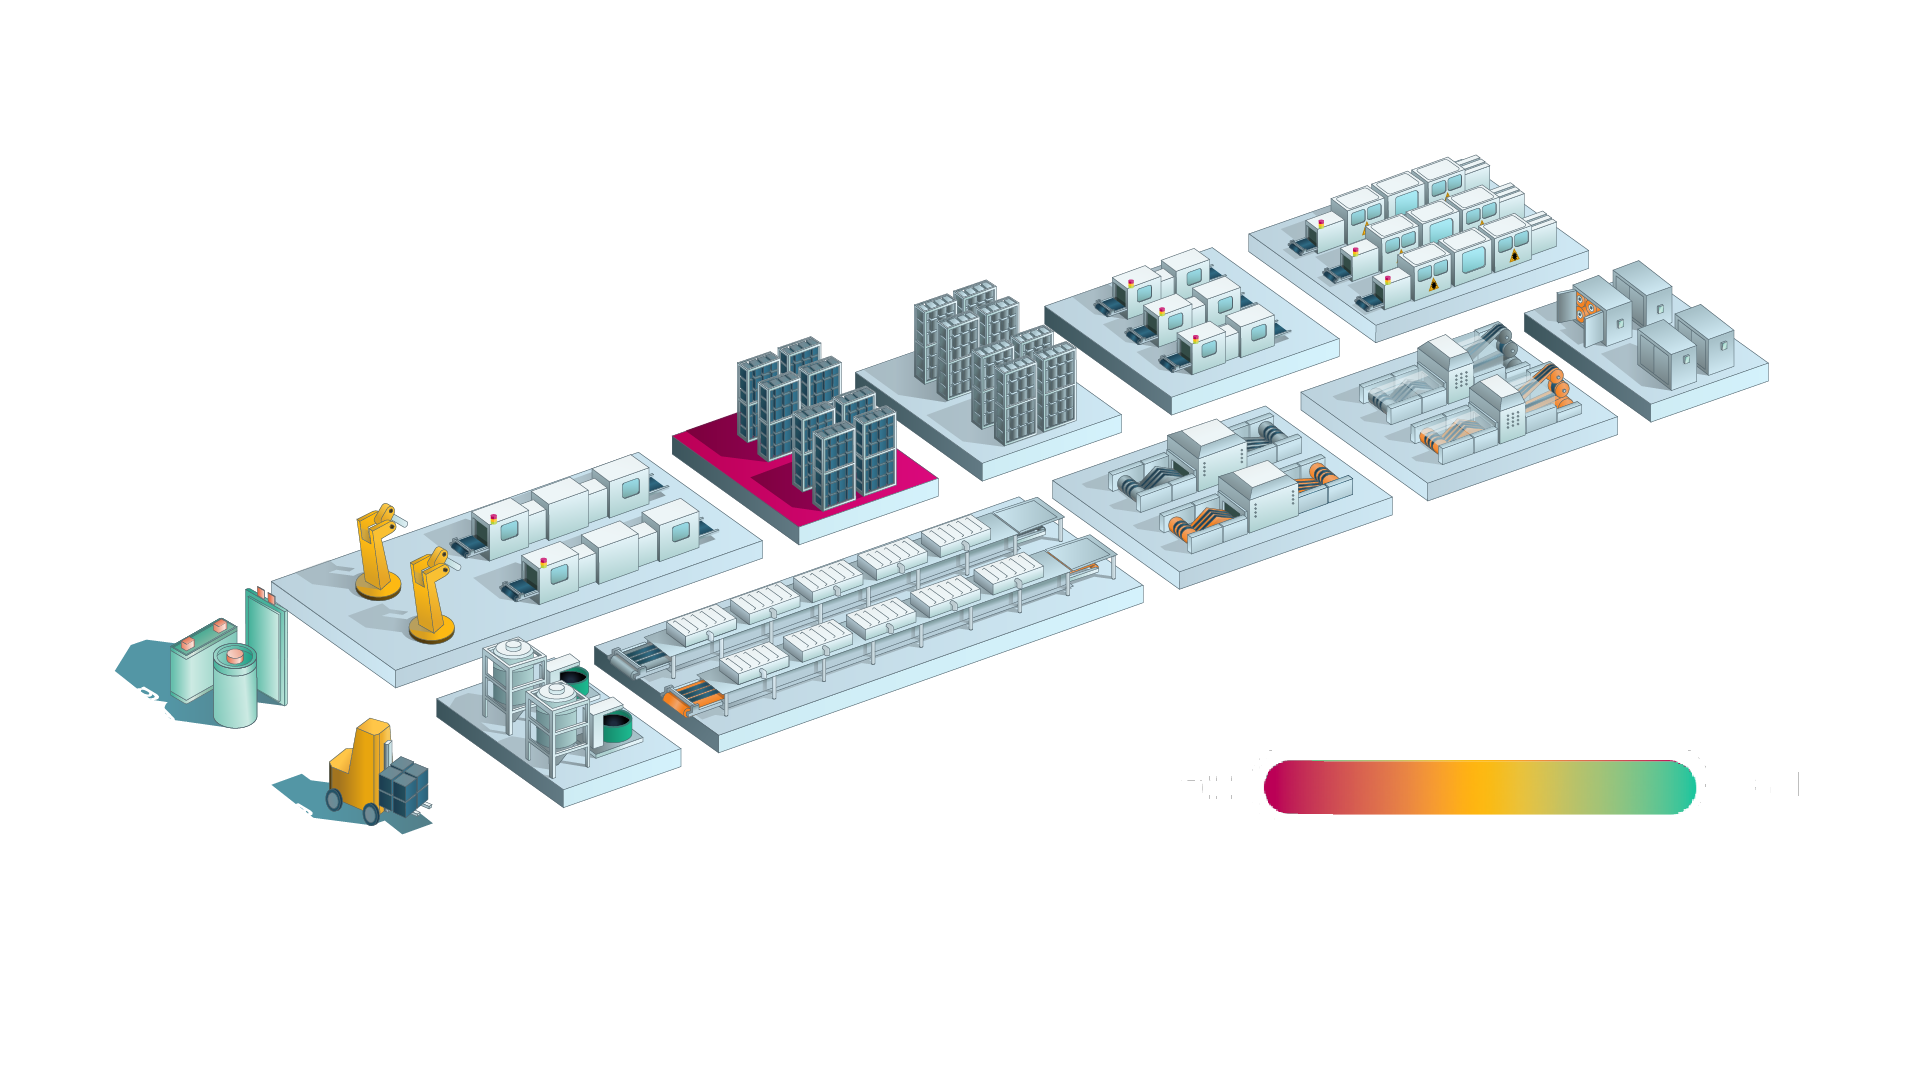
The formation process step is a common bottleneck in battery cell manufacturing when analyzing throughput and machine output. The formation process generally consists of the initial charging and discharging cycles in order to activate the cell activity. This is based on the formation of the solid-electrolyte interface (SEI). The limiting factor in the formation process step is primarily the reaction rate. The reaction rate is limited by various factors, including reaction kinetics and/or solid-state diffusion. Another factor limiting the throughput of this process step is the temperature used. Overall, formation is thermally sensitive. The industry standard for the temperature used ranges from 25°C to 40°C. Due to these two main factors, throughput and machine output are significantly limited. There are optimization approaches that are commonly integrated and implemented. Nonetheless, the formation process step remains to be a bottleneck in terms of throughput and machine output.
The throughput for the formation process step ranges from 0.34 m/min to 12.5 m/min. This metric was converted by the time required, in hours, per cell.
Aging
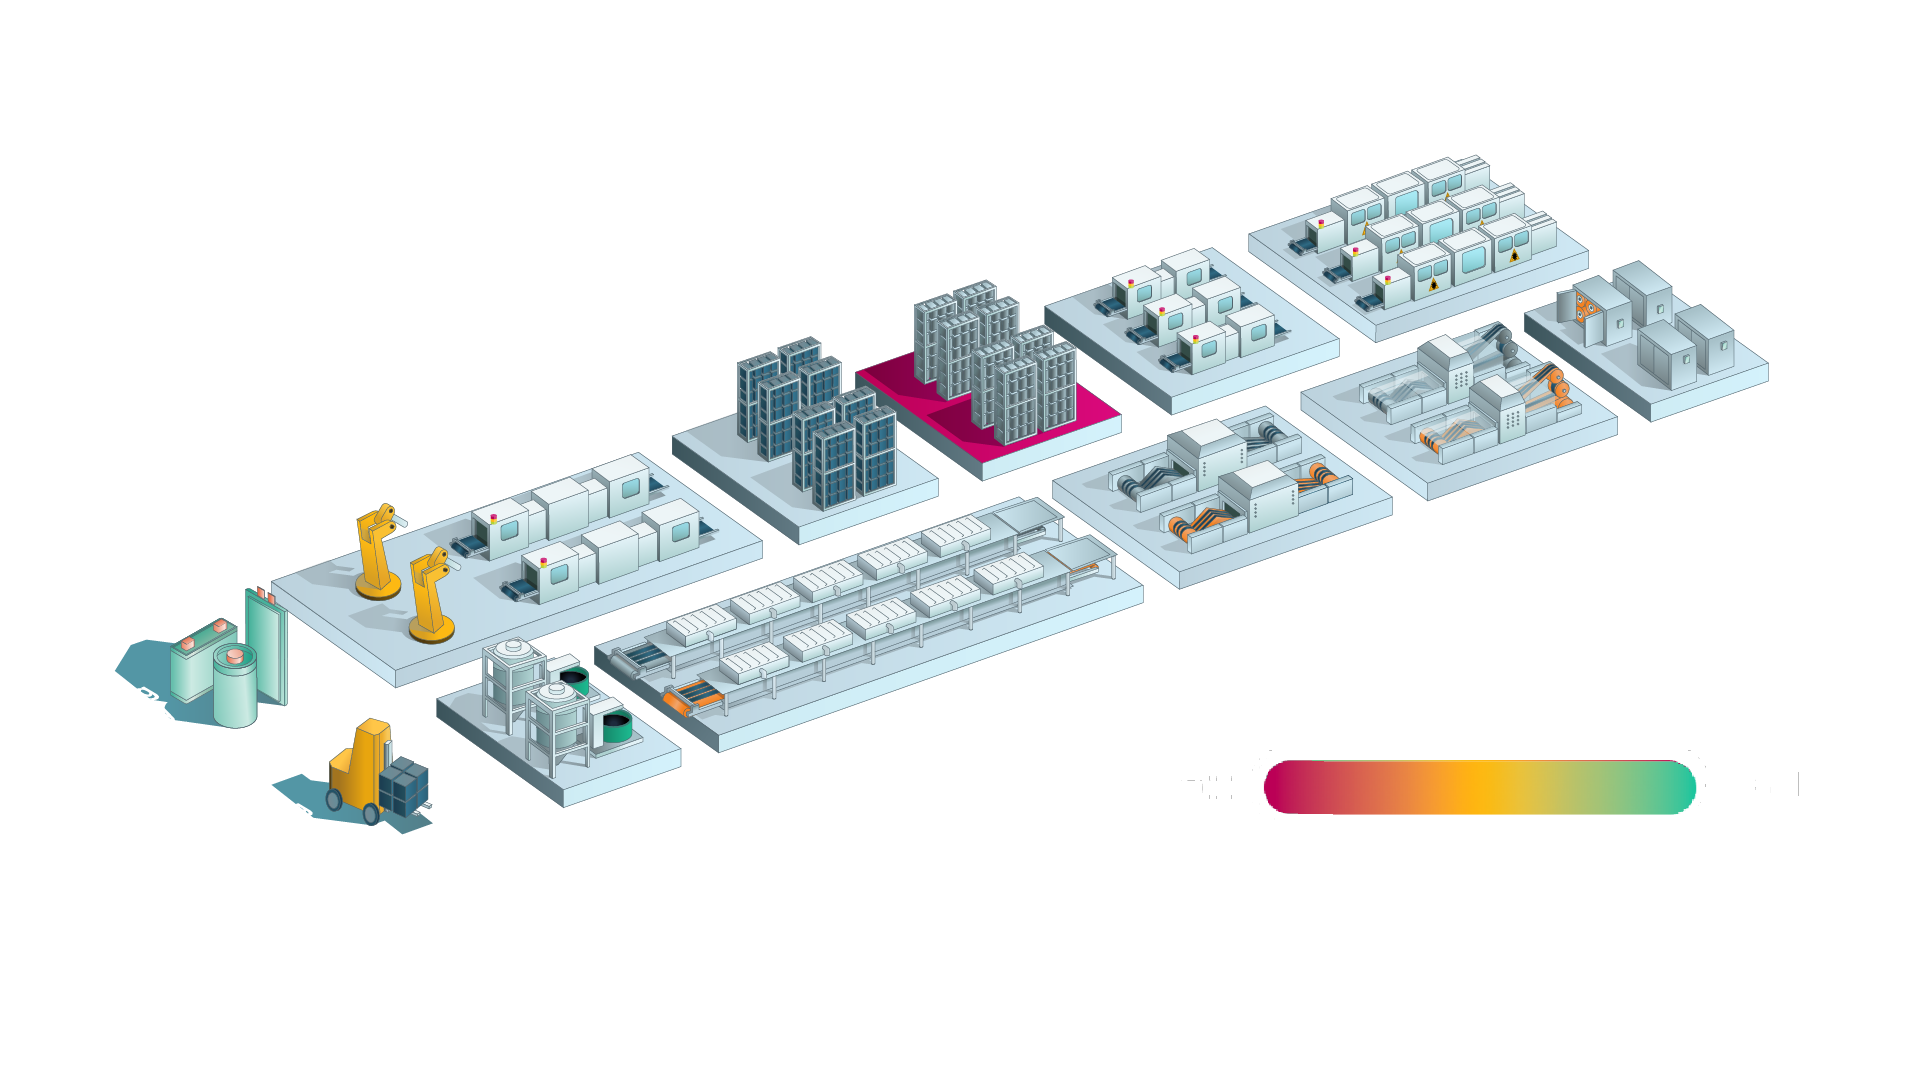
Relatively low throughput and machine output
The aging process step has a significant impact on the quality of the manufactured battery cells. The main limitation is the aging duration. The aging duration varies substantially between different battery cell manufac-turers. It can be optimized by combining aging at room temperature (RT) with aging at elevated temperature or even at high temperature (HT). Typically, a distinction is made between the two approaches, RT and HT. Another approach involves integrat-ing the aging process step into the formation process step, thereby reducing the time required. In turn, this has a positive effect on both throughput and machine output. Further optimization strategies hold the potential to further increase the throughput of the aging process step. Potential approaches include Electrochemical Impedance Spectroscopy (EIS) to monitor and identify cells that are produced with anomalies. Despite a variety of approaches to optimizing the aging process step, throughput and machine output remain relatively low.
The throughput for the aging process step ranges from 0.06 m/min to 14.3 m/min. This metric was converted by the time required, in days, per cell.
End-of-line Quality Control
Low throughput impairs throughput in battery cell production
The End-of-Line (EoL) quality control refers to the process of ensuring the quality and performance of battery cells before they leave the plant. The respective protocol to ensure the latter differs across battery manufacturers. A common component of EoL is electrical characterization, consisting of open circuit voltage (OCV), internal resistance testing, and capacity measurement. Further tasks associated with EoL may include pulse tests, optical inspections, or leak tests. To reduce the time required for the EoL process step, manufacturers are opting for parallel testing stations, “intelligent” sampling strategies, or new approaches based on machine learning. However, the individual optimization strategy is dependent on the respective battery cell manufacturing plant. Overall, the majority of optimization strategies aim to reduce the time required for the EoL process step in order to positively impact throughput and machine output.
The throughput for the End-of-line Quality Control process step ranges from 9.7 m/min to 13.4 m/min. This metric was converted by the rate min/cell for electrical characterization and cells/hour for the optical assessment.
Outgoing Quality Control
Plant-specific, varying impacts on throughput
The throughput and machine output of the Outgoing Quality Control (OQC) process step vary depending on the plant and the specifications of the manufacturing process. Overall, OQC aims to ensure that only high quality cells exit the plant. This process is important not only for meeting quality standards of the battery cell manufacturer. The throughput and machine output therefore depend on the time required to perform the associated tasks. Typically, the produced cell is analyzed through, e.g., a visual inspection of defects to ensure that the dispatched battery cells are of high quality.
Throughput and machine output depend on the manufacturing process and the specific tasks within the plant.